Can Embedding/Reranker Models Compare Numbers?
A lot of LLMs can't figure out that 9.11 is actually smaller than 9.9. Can our embedding and reranker models do any better?

This was a question I was asked at the ICML conference in Vienna today.
During the coffee break, a Jina user approached me with a question that stemmed from recent discussions in the LLM community. He asked if our embedding model could tell that 9.11 is smaller than 9.9, a task where many LLMs tell the other way.
9.11 is bigger than 9.9. pic.twitter.com/zBrdLGAoH2
— Riley Goodside (@goodside) July 15, 2024
"Honestly, I don't know," I responded. As he elaborated on the importance of this capability for his application and suggested that tokenization might be the root of the problem, I found myself nodding in agreement - my mind was already racing with ideas for an experiment to uncover the answer.
In this article, I want to test if our embedding model, jina-embeddings-v2-base-en (released October 2023), and the Reranker, jina-reranker-v2-multilingual (released June 2024), can accurately compare numbers. To extend the scope beyond the simple comparison of 9.11 and 9.9, I have designed a set of experiments that include various types of numbers: small integers, large numbers, floats, negative numbers, currency, dates, and times. The goal is to assess the effectiveness of our models in handling different numerical formats.
Experimental Setup
The full implementation can be found in the Colab below:


The design of the experiment is quite straightforward. For example, to check if the embedding model understands numbers between [1, 100]. The steps are as follows:
- Construct Documents: Generate "string literal" documents for each number from
1to100. - Send to Embedding API: Use the Embedding API to obtain embeddings for each document.
- Compute Cosine Similarity: Calculate the pairwise cosine similarity for every two documents to create a similarity matrix.
- Do Scatter Plot: Visualize the results using a scatter plot. Each element $(i, j)$ in the similarity matrix is mapped to a point with: X-axis: $(i - j)$; Y-axis: the similarity value of $(i, j)$
If the delta $(i - j)$ is zero, i.e., $i = j$, then the semantic similarity should be the highest. As the delta $(i - j)$ increases, the similarity should decrease. Ideally, the similarity should be linearly proportional to the delta value. If we can't observe such linearity, then it is likely that the model cannot understand the numbers and may produce error such that 9.11 is greater than 9.9.
The Reranker model follows a similar procedure. The key difference is that we iterate through the constructed documents, setting each one as the query by prepending the prompt "what is the closest item to..." and ranking all others as documents. The relevance score returned by the Reranker API is used directly as the semantic similarity measure. The core implementation looks as follows.
def rerank_documents(documents):
    reranker_url = "https://api.jina.ai/v1/rerank"
    headers = {
        "Content-Type": "application/json",
        "Authorization": f"Bearer {token}"
    }

    # Initialize similarity matrix
    similarity_matrix = np.zeros((len(documents), len(documents)))

    for idx, d in enumerate(documents):
        payload = {
            "model": "jina-reranker-v2-base-multilingual",
            "query": f"what is the closest item to {d}?",
            "top_n": len(documents),
            "documents": documents
        }
    ...
Can Models Compare Numbers Between [1, 2, 3, ..., 100]?


Scatter plot with mean and variance on each delta. Left: jina-embeddings-v2-base-en; Right: jina-reranker-v2-multilingual. documents = [str(i) for i in range(1, 101)]
How to Read These Plots
Before we moving on with more experiments, let me first explain how to properly read these plots. First off, my observation from the two plots above is that the embedding model performs well, whereas the reranker model doesn’t fare as great. So, what are we looking at and why?
The X-axis represents the delta of the indices $(i,j)$, or $i-j$, when we uniformly sample $d_i$ and $d_j$ from our document sets. This delta ranges from $[-100, 100]$. Since our document set is sorted by construction, i.e. the smaller the $|i-j|$, the closer $d_i$ and $d_j$ are semantically; the further apart $i$ and $j$ are, the lower the similarity between $d_i$ and $d_j$. That’s why you see the similarity (represented by the Y-axis) spike at $X=0$ and then drop linearly as you move left and right.
Ideally, this should create a sharp peak or an "up-arrow" shape like ^. However, that’s not always the case. If you fix the X-axis at a point, say $X=25$, and look along the Y-axis, you’ll find similarity values ranging from 0.80 to 0.95. That means, $\mathrm{sim}(d_27, d_2)$ may be 0.81 whereas $\mathrm{sim}(d_42, d_17)$ may be 0.91 despite their delta are all 25.
The cyan trendline shows the mean similarity at each X value with the standard deviation. Also, note that the similarity should drop linearly because our document set is evenly spaced, ensuring equal intervals between contiguous documents.
Note that embedding plots will always be symmetric, with the largest Y-value of 1.0 at $X=0$ This is because cosine similarity is symmetric for $d_i$ and $d_j$, and $\cos(0)=1$.
On the flip side, reranker plots are always asymmetric due to the different roles of the query and documents in the reranker model. The maximum value is likely not 1.0 because $X=0$ means we use the reranker to compute the relevance score of "what is the closest item to 4" vs "4". If you think about it, there is no guarantee that $X=0$ leads to the maximum Y-value.
Can Models Compare Negative Numbers Between [-100, -99, -98, ..., -1]?


Scatter plot with mean and variance on each delta. Left: jina-embeddings-v2-base-en; Right: jina-reranker-v2-multilingual. Here we want to test if the model can tell the semantic similarity in the negative space. documents = [str(-i) for i in range(1, 101)]
Can Models Compare Numbers with Larger Intervals [1000, 2000, 3000, ..., 100000]?


Here we want to test if the model can tell the semantic similarity when we compare numbers with a interval of 1000. documents = [str(i*1000) for i in range(1, 101)] Scatter plot with mean and variance on each delta. Left: jina-embeddings-v2-base-en; Right: jina-reranker-v2-multilingual.
Can Models Compare Numbers From An Arbitrary Range, e.g. [376, 377, 378, ..., 476]?


Here we want to test if the model can tell the semantic similarity when we compare numbers in an arbitrary range, so we move the numbers to some random range documents = [str(i+375) for i in range(1, 101)] . Scatter plot with mean and variance on each delta. Left: jina-embeddings-v2-base-en; Right: jina-reranker-v2-multilingual.
Can Models Compare Large Numbers Between [4294967296, 4294967297, 4294967298, ..., 4294967396]?


Here we want to test if the model can tell the semantic similarity when we compare very large numbers. Similar to the idea of last experiment, we move the range further to a large number. documents = [str(i+4294967296) for i in range(1, 101)] Scatter plot with mean and variance on each delta. Left: jina-embeddings-v2-base-en; Right: jina-reranker-v2-multilingual.
Can Models Compare Float Numbers Between [0.0001, 0.0002, 0.0003, ...,0.1]? (w/o fixed digits)


Here we want to test if the model can tell the semantic similarity when we compare floats. documents = [str(i/1000) for i in range(1, 101)] Scatter plot with mean and variance on each delta. Left: jina-embeddings-v2-base-en; Right: jina-reranker-v2-multilingual.
Can Models Compare Currency Numbers Between [$1, $2, $3, ..., $100]?


Here we want to test if the model can tell the semantic similarity when we compare number in currency. documents = ['$'+str(i) for i in range(1, 101)] Scatter plot with mean and variance on each delta. Left: jina-embeddings-v2-base-en; Right: jina-reranker-v2-multilingual.
Can Models Compare Date Between [2024-07-24, 2024-07-25, 2024-07-26, ..., 2024-10-31]?


Here we want to test if the model can tell the semantic similarity when we compare number in date format, i.e. YYYY-MM-DD. today = datetime.today(); documents = [(today + timedelta(days=i)).strftime('%Y-%m-%d') for i in range(100)] Scatter plot with mean and variance on each delta. Left: jina-embeddings-v2-base-en; Right: jina-reranker-v2-multilingual.
Can Models Compare Time Between [19:00:07, 19:00:08, 19:00:09,..., 20:39:07]?


Here we want to test if the model can tell the semantic similarity when we compare number in time format, i.e. hh:mm:ss. now = datetime.now(); documents = [(now + timedelta(minutes=i)).strftime('%H:%M:%S') for i in range(100)] Scatter plot with mean and variance on each delta. Left: jina-embeddings-v2-base-en; Right: jina-reranker-v2-multilingual.
Observations
Here are some observations from the plots above:
Reranker Models
- Reranker models struggle with comparing numbers. Even in the simplest case of comparing numbers between [1, 100], their performance is subpar.
- It is important to note the special prompt construction used for queries in our reranker usage, i.e.,
what is the closest item to x, as this may also impact the results.
Embedding Models
- Embedding models perform reasonably well when comparing small integers within the range [1, 100] or negative numbers within [-100, 1]. However, their performance degrades significantly when shifting this span to other values, adding more intervals, or dealing with larger or smaller floats.
- Regular spikes can be observed at certain intervals, usually every 10 steps. This behavior may be related to how the tokenizer processes the strings, potentially tokenizing a string into "10" or "1" and "0".
Date and Time Understanding
- Interestingly, embedding models seem to have a good understanding of dates and times, correctly comparing them most of the time. For date plots, spikes appear at every 30/31 steps, corresponding to the number of days in a month. For time plots, spikes appear at every 60 steps, corresponding to minutes in an hour.
- The reranker models also seem to capture this understanding to some extent.
Visualizing Similarity to "Zero"

Another interesting experiment, which is probably more intuitive, is to directly visualize the similarity or relevance score between any number and zero (i.e., the origin). By fixing the reference point as the embedding of zero, we want to see if the semantic similarity decreases linearly as the numbers get larger. For the reranker, we can fix the query to "0" or "What is the closest number to number zero?" and rank all numbers to see if their relevance scores decrease as the numbers increase. The results are shown below:


Here, we fix the "origin embedding" to the embedding of "zero" and check if the semantic similarity between any number and zero is proportional to the value of the number. Specifically, we use documents = [str(i) for i in range(2048)]. The scatter plot with mean and variance for each delta is shown. Left: jina-embeddings-v2-base-en; Right: jina-reranker-v2-multilingual.
Conclusion
This article illustrates how our current embedding and reranker models handle number comparisons. Despite the relatively simple experimental setup, it exposes some fundamental flaws in the current models and provides valuable insights for the development of our next of embedding and reranker.
Two key factors determine whether a model can accurately compare numbers:
First, tokenization: If the vocabulary only includes digits 0-9, then 11 might be tokenized into separate tokens 1 and 1, or as a single token 11. This choice impacts the model's understanding of numerical values.
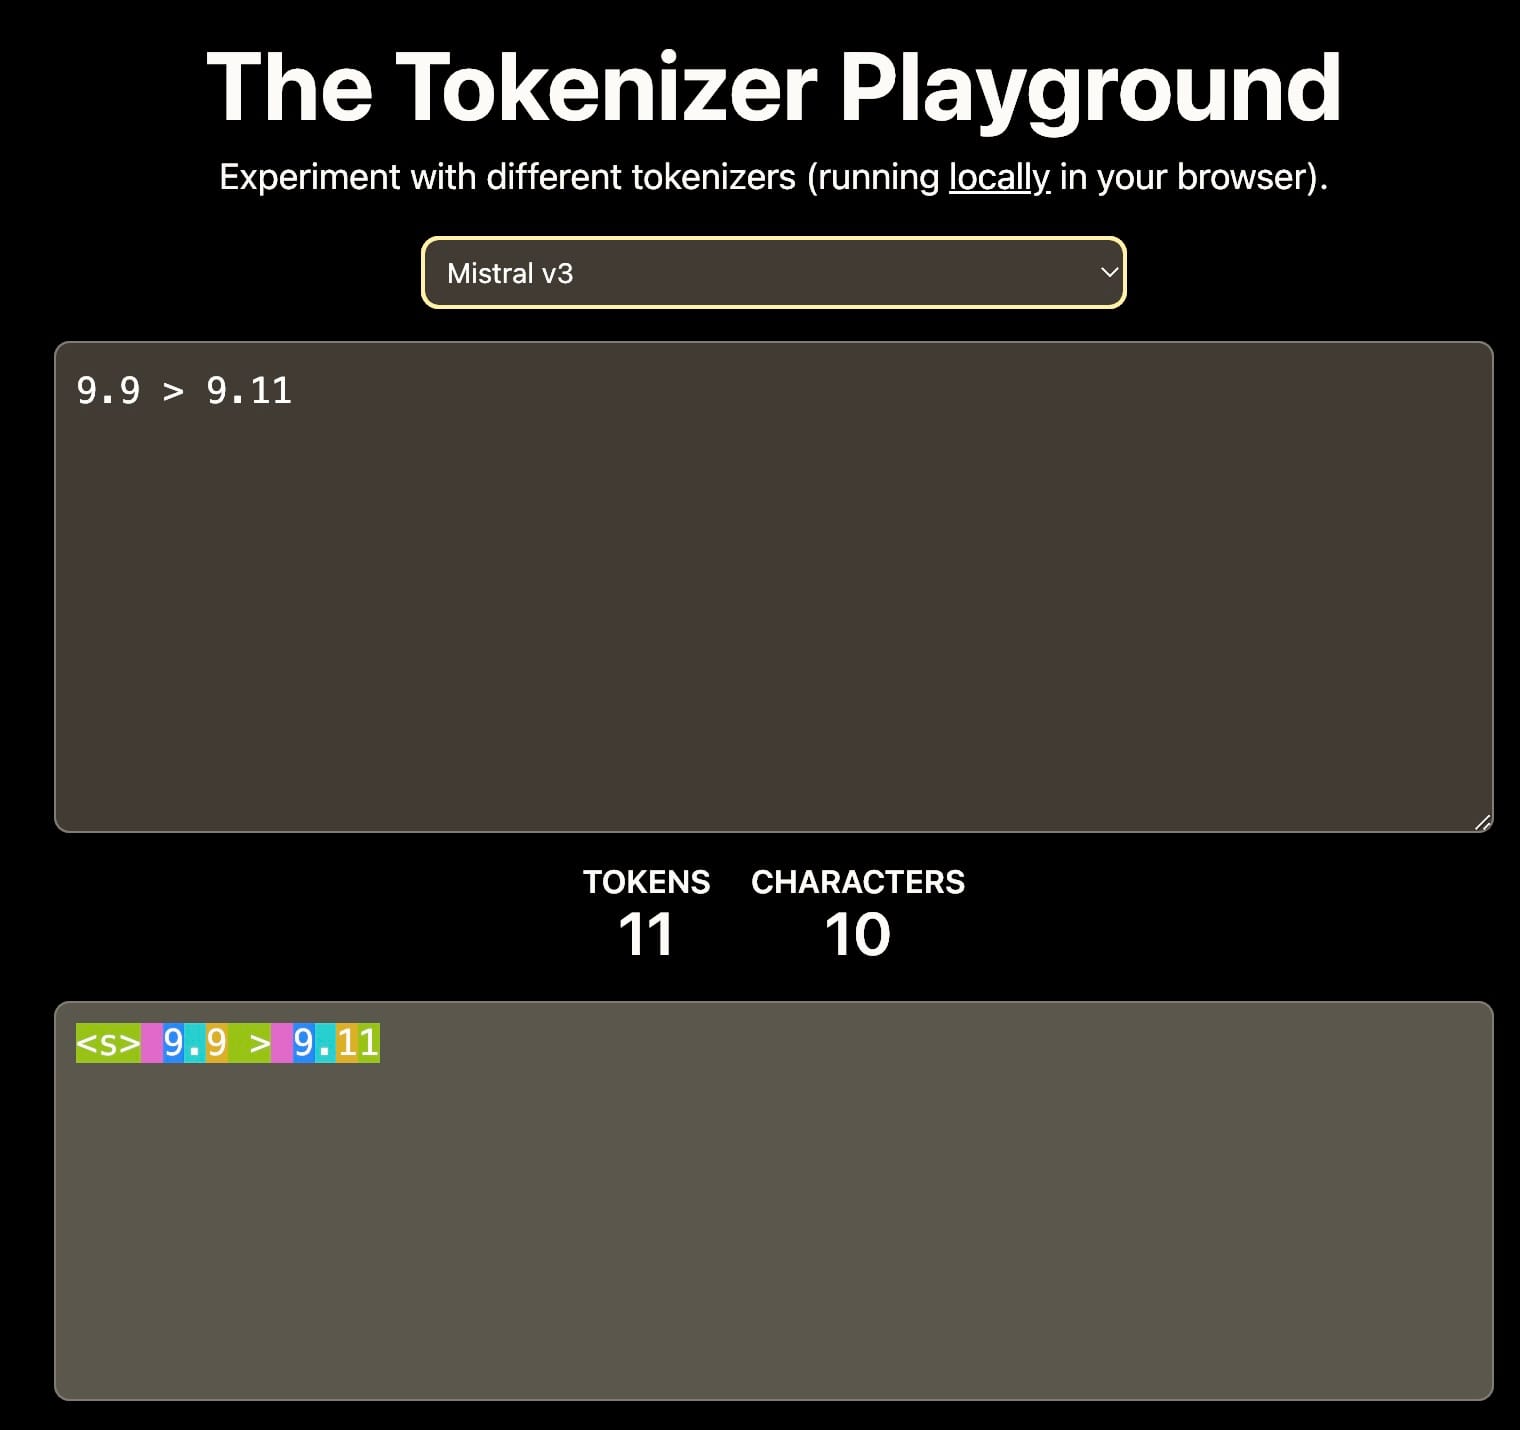
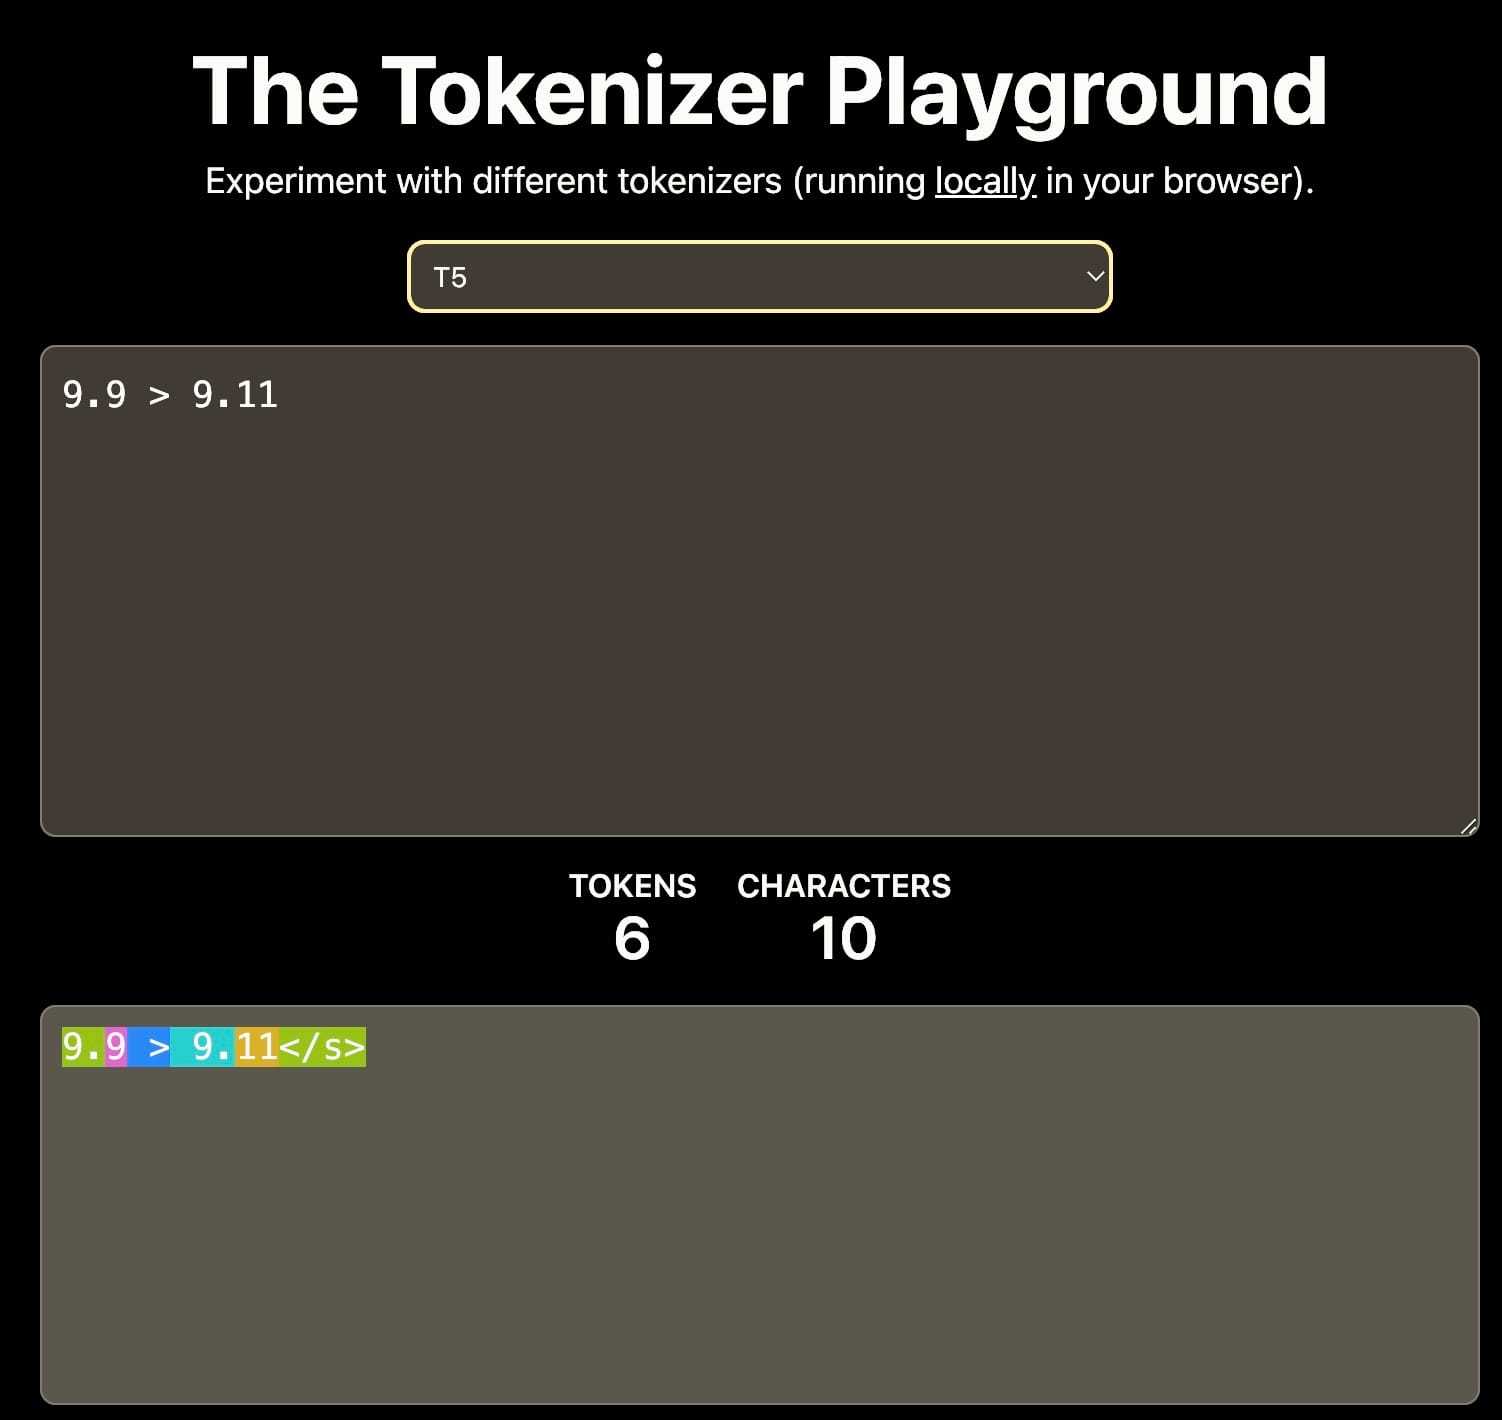
Different tokenizers result in different interpretation of 9.11. This can affect the downstream contextual learning. Source: The Tokenizer Playground on HuggingFace.
Second, training data: The training corpus significantly influences the model's numerical reasoning abilities. For example, if the training data mainly includes software documentation or GitHub repositories where semantic versioning is common, the model might interpret that 9.11 is greater than 9.9, as 9.11 is the minor version following 9.9.
The arithmetic capability of dense retrieval models, such as embeddings and rerankers, is crucial for tasks involving RAG and advanced retrieval and reasoning. Strong numerical reasoning abilities can significantly enhance search quality, particularly when dealing with structured data like JSON.